 Weibo
Weibo Operations
Control Plane and Dashboard
Run jobs as containers and watch them in the web UI.
The control plane is optional. It gives you a REST API, a CLI, and a web UI for running pipelines as managed containers with restarts, savepoints, and live metrics.
Run it locally
cd control && go run ./cmd/weibo dashboard # opens http://localhost:9000See it with a real job (needs Docker and jq):
make dashboard-demoThis builds the stream-demo job, boots the dashboard, and submits a
continuously running pipeline. Ctrl-C tears it down.
What you get
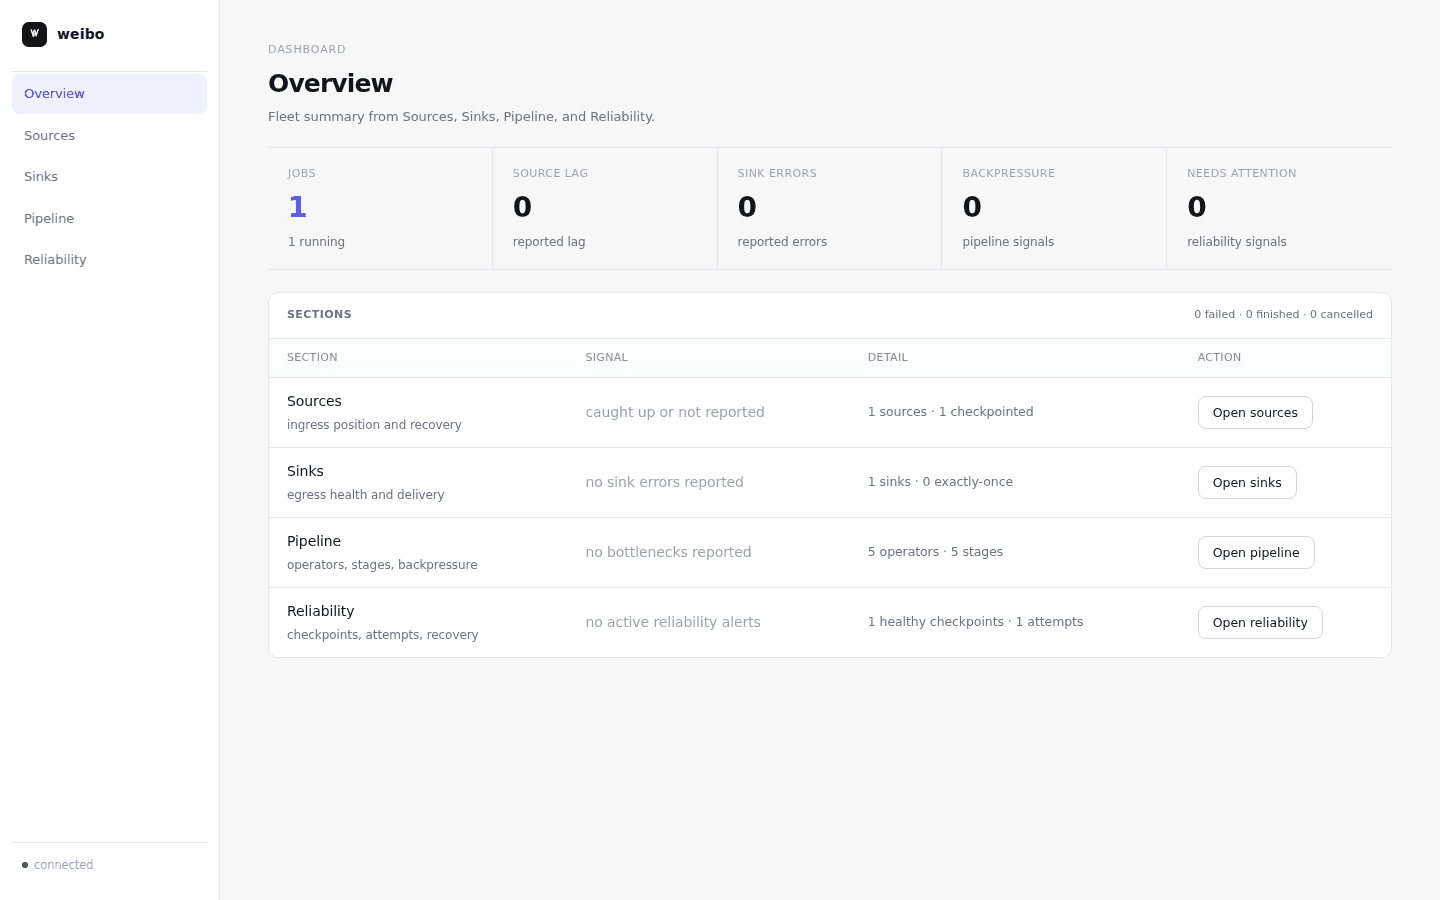
- Overview: fleet health, throughput, failing jobs
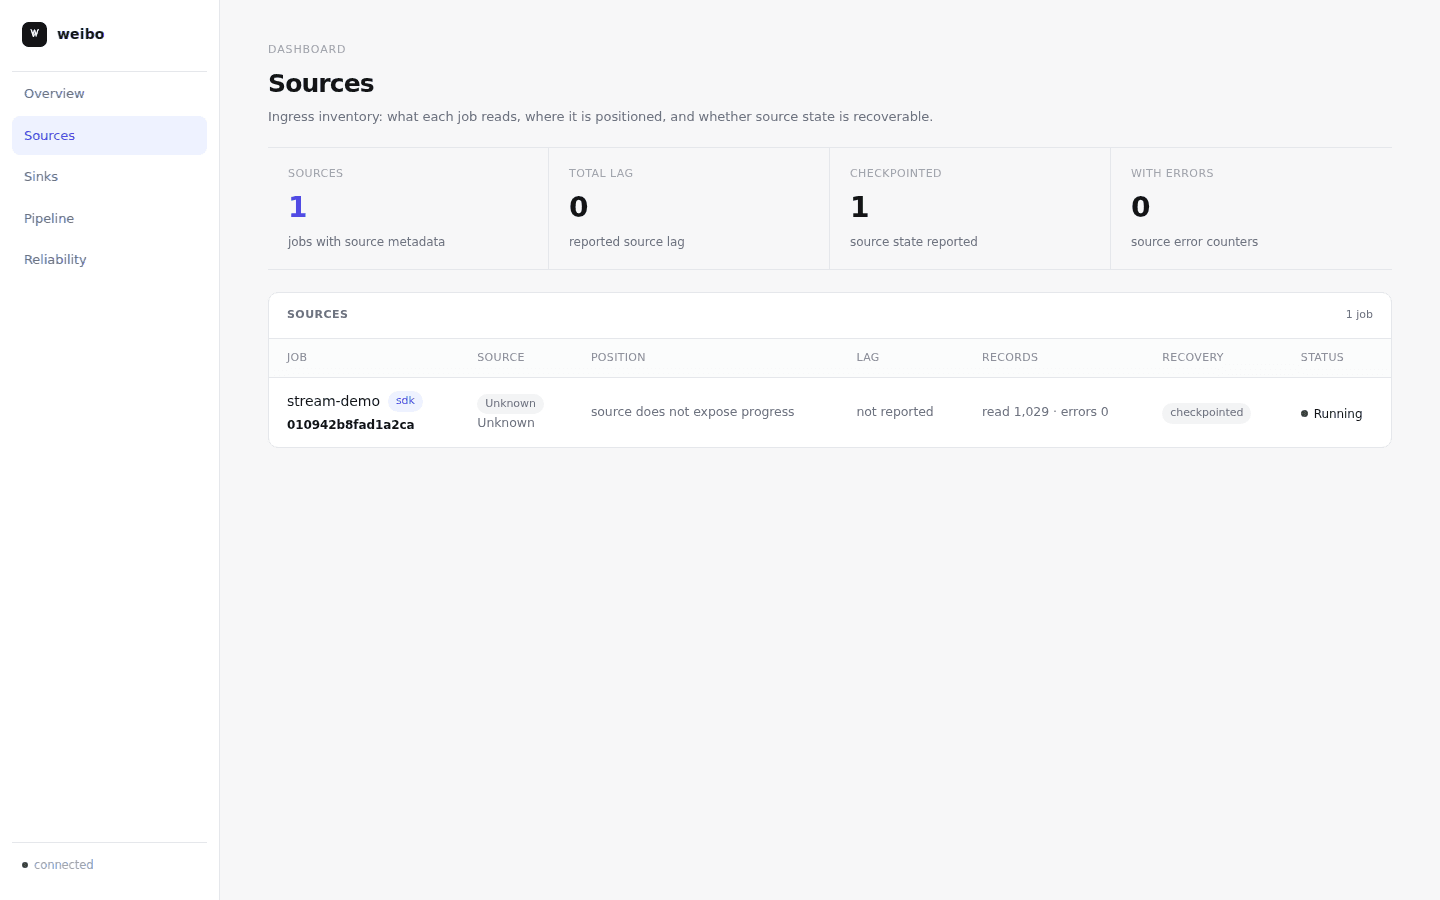
- Sources: position, lag, read and error counters
- Sinks: delivery guarantee, destination, records written
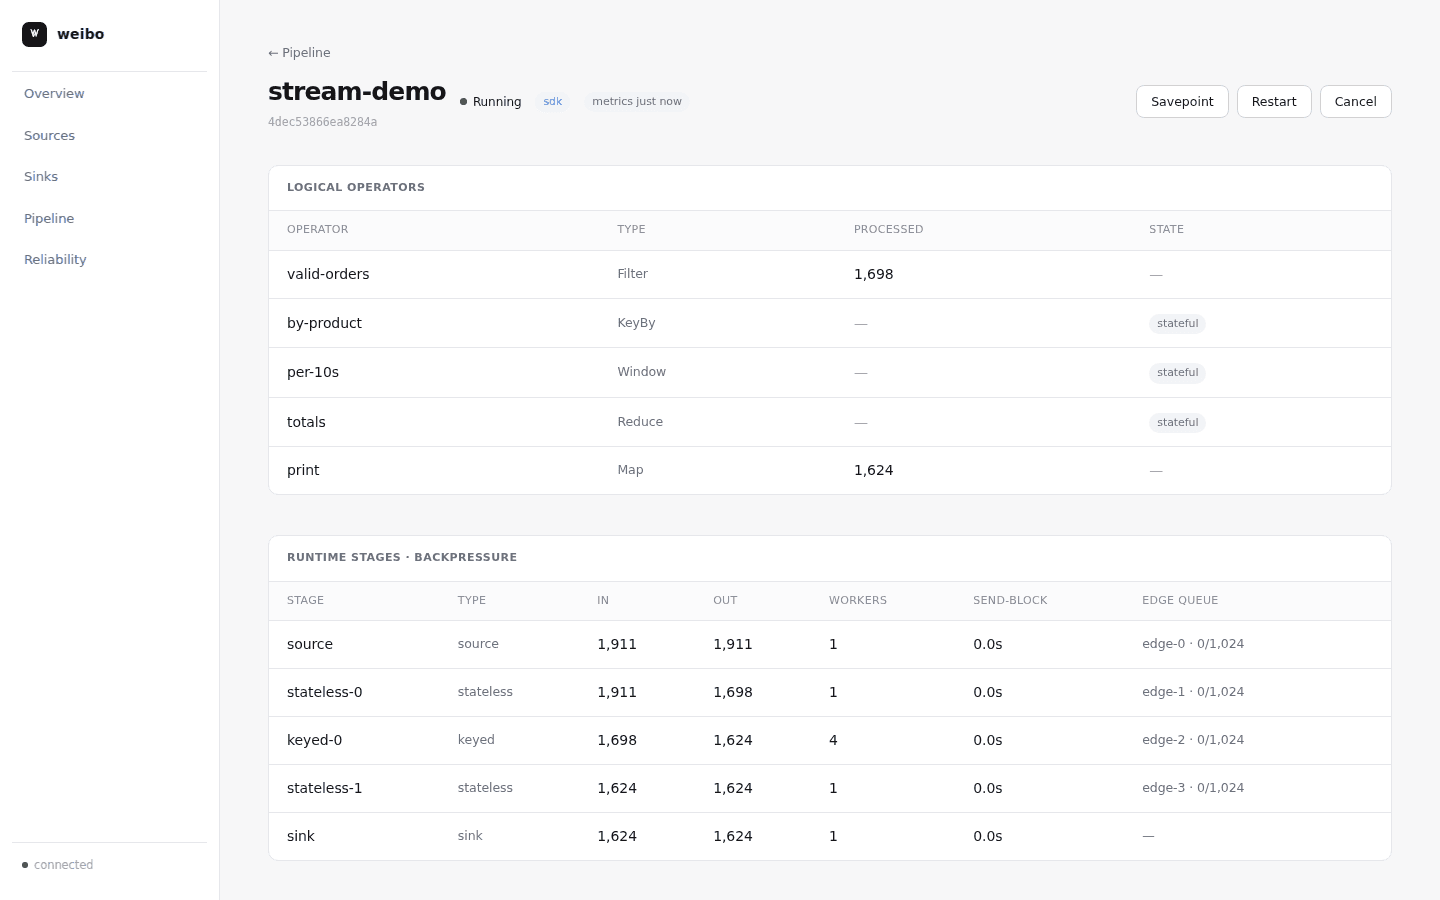
- Pipeline: operator graph, runtime stages, backpressure per edge
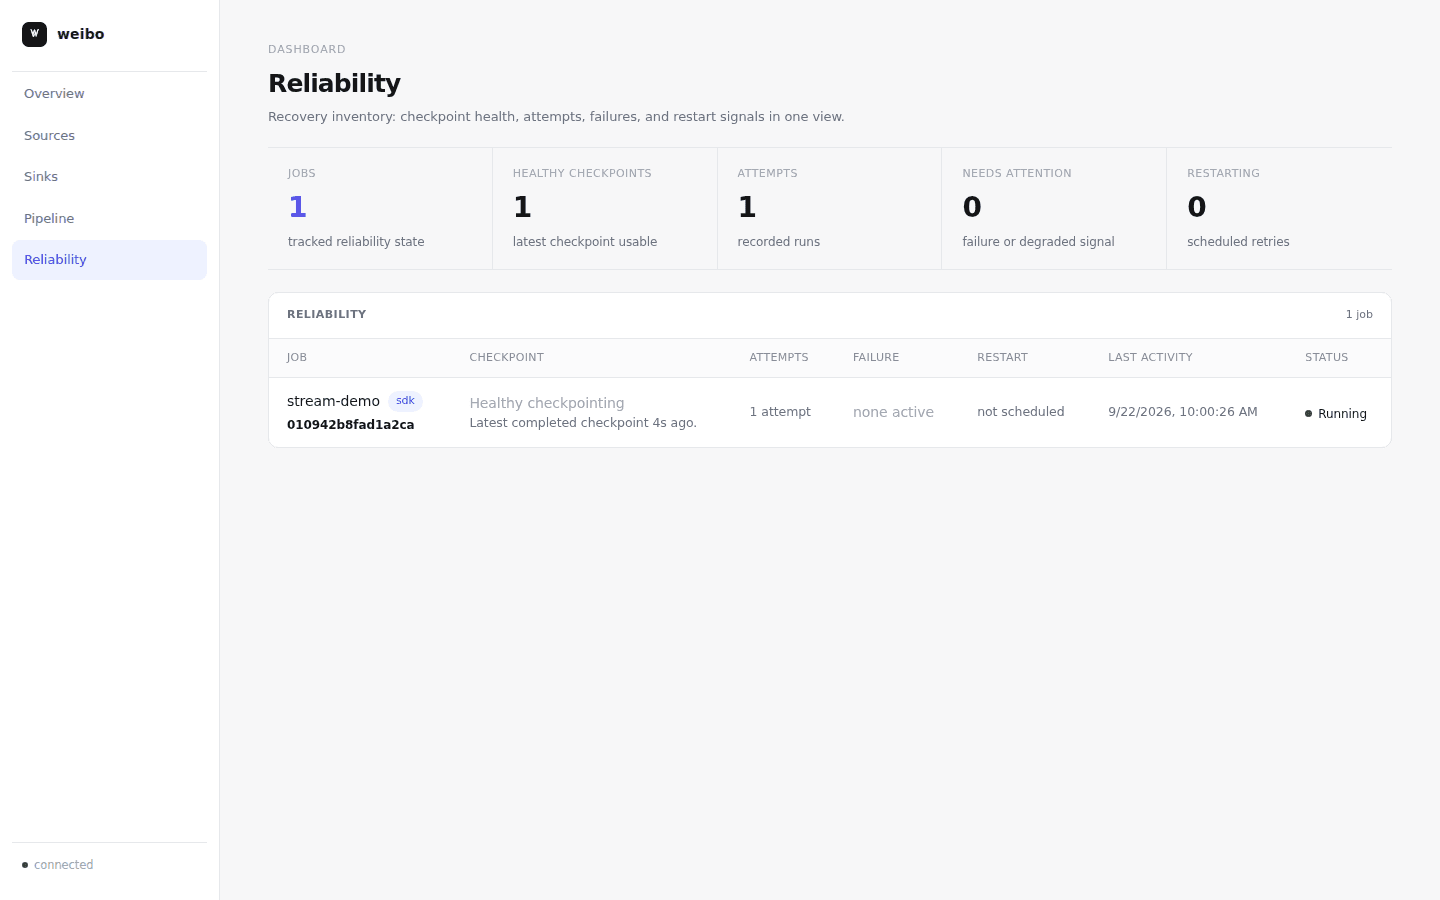
- Reliability: checkpoints, restarts, failure reasons
- Runs and logs: every attempt, with live log follow
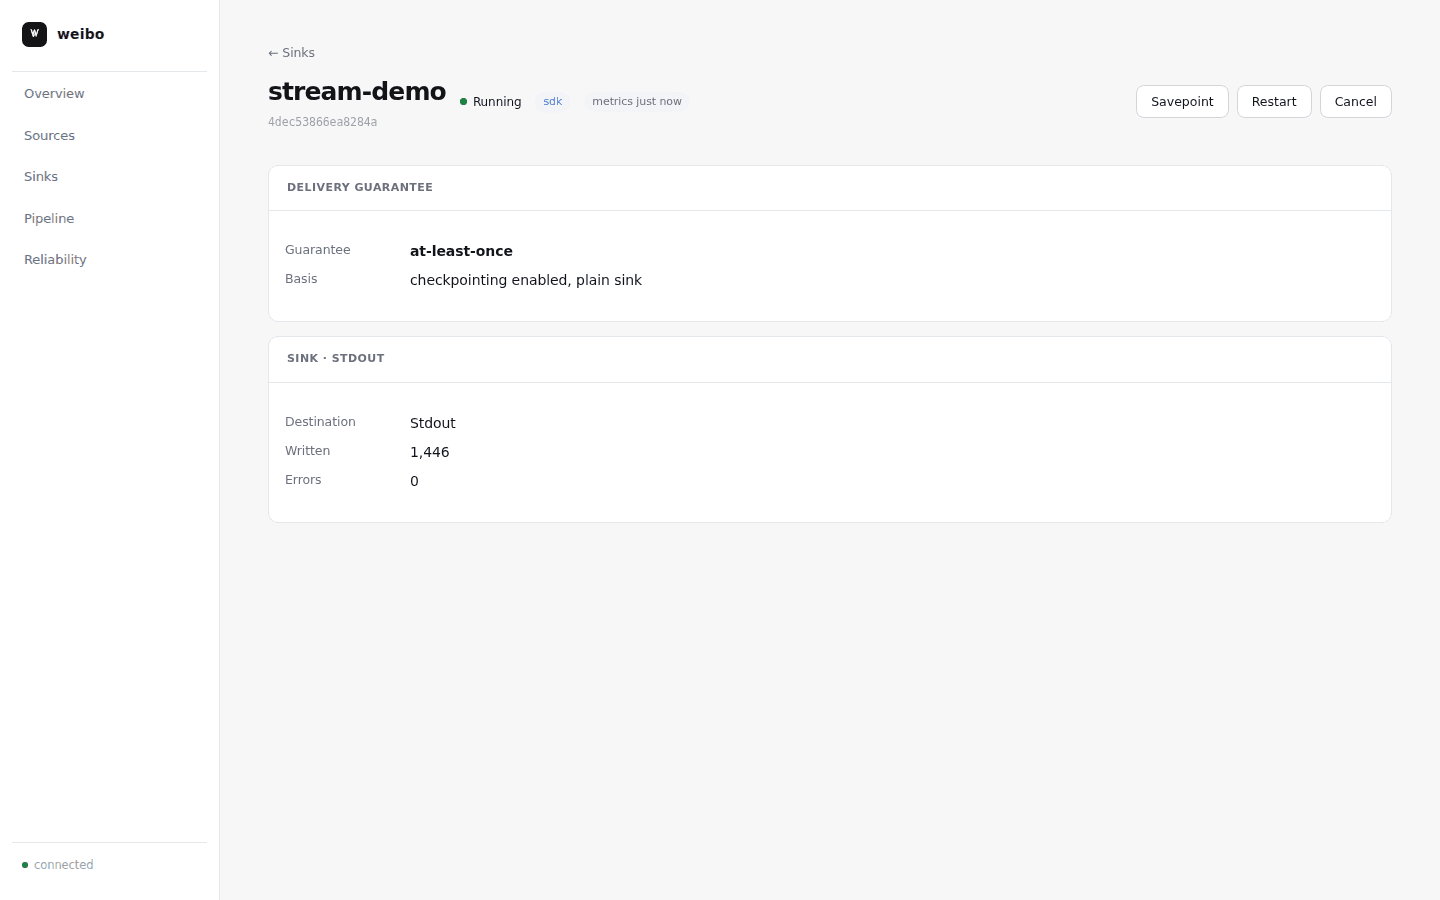
Job lifecycle
weibo deploy -file job.yaml     # submit
weibo jobs                      # list
weibo status <id>               # detail + latest run
weibo logs <id> -follow         # stream logs
weibo savepoint <id> -label v1  # stop with a savepoint
weibo restart <id> -savepoint v1
weibo cancel <id>
weibo delete <id> -delete-data
Grafana
Pass -grafana-url (or WEIBO_GRAFANA_URL) to add Grafana deep links on job
and run pages. make prod-like-up starts a local stack with Prometheus and
Grafana prewired.
Production setup: Deployment. API: REST API.